 It’s crucial to stay informed on key social media statistics and demographics to make marketing strategy decisions. It’s important to know where your target audience spends time and how they’re using different social media platforms. The best marketing choices are based on statistics and fact, so when it comes to your marketing, numbers are your best friend!
Here are the essential demographics to know for top social media sites:
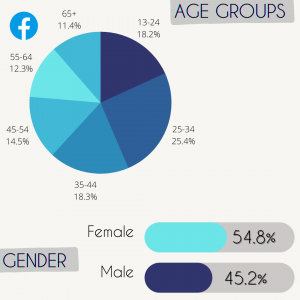
- 74 billion monthly active users
- Over 98% of users access Facebook through a mobile device
- 88% of Facebook users use the platform to keep in contact with friends and family
- On average, users spend 58 minutes daily on Facebook
Facebook leads the pack with over 2 billion monthly active users. With many users using the platform to stay in touch with connections, Facebook is widely embraced as a space to create communities and start conversations.
 Instagram
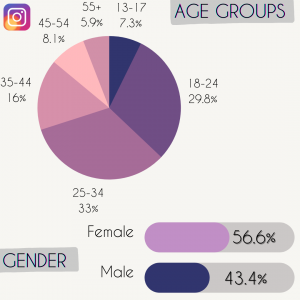
- 22 billion monthly active users
- Instagram has 500 million daily active users
- A survey shows 87% of users act after seeing product information on Instagram (i.e., following a brand, visiting their website, making a purchase online)
- On average, users spend 30 minutes daily on Instagram
- A survey shows 81% said Instagram helps them research products and services
One of the most popular social sites worldwide, Instagram is expected to maintain its user growth and continue to rise in popularity. Research has shown that Instagram plays a significant role in the buying journey by raising brand awareness and driving sales.
 Twitter
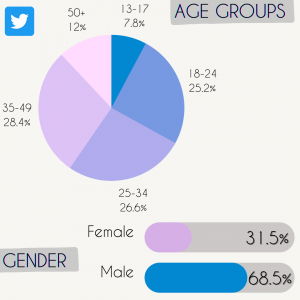
- 353 million monthly active users
- On average, Twitter users spend 53 minutes per session
- A survey showed 48% of users use Twitter to receive news
- 80% of users access Twitter though a mobile device
Twitter’s user count has remained consistent over time with research showing that about 22% of U.S. adults use Twitter. Twitter’s audience tends to be more news-focused, making the platform an ideal space for brands to share updates and information.
 LinkedIn
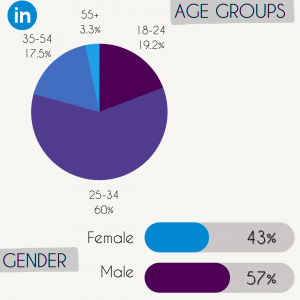
- 310 million monthly active users
- On average, users spend less than a minute daily and 17 minutes monthly on LinkedIn
- 57% of LinkedIn traffic comes from mobile devices
- Most preferred site for B2B marketers to distribute content at 94%.
As a top professional networking platform, more than 55 million companies utilize LinkedIn for business purposes. LinkedIn is an ideal space for companies to showcase their brand, network with other professionals, find new talent and keep audiences updated.
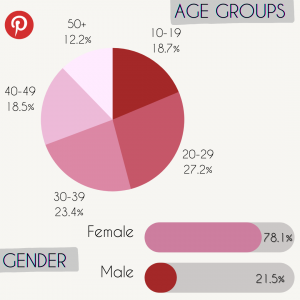 Pinterest
- 442 million monthly active users
- On average, users spend 2 minutes daily on Pinterest
- The number of users shopping on Pinterest has increased 44% year over year
- 85% of users access Pinterest through a mobile device
- Surveys show 22% of B2B and 28% of B2C social media marketers use Pinterest to market their business
Branded as a visual discovery engine, Pinterest is an ideal platform for brands to promote products as research shows 77% of weekly users have discovered a new brand or product on the platform. Intriguing pictures and other visuals reign supreme on this platform so brands should incorporate optimized images.
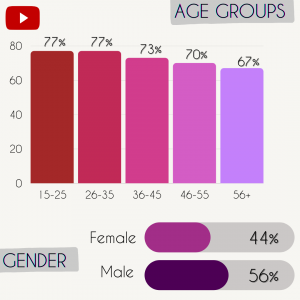 YouTube
- 29 billion monthly active users
- On average, users spend about 41.9 minutes daily on YouTube
- Surveys show 9% of YouTube watch time comes from mobile devices
- 82% of users use YouTube to find entertainment
Ranking at second place in global internet engagement, YouTube is used by 74% of adults in the U.S. With studies that show 70% of people say they bought a brand after seeing it on YouTube, companies can use the platform to implement video ads strategically to find new leads and drive sales.
We’d love your feedback on these social media statistics and demographics. Does anything here surprise you? Where does your business find the best engagement?
Denim Marketing would love to work with you to help ensure your company’s social media success. Contact us here or at 770-383-3360.
Leave a Reply